- ProductsDashboards for smart marketers for real-time view of marketing data across multiple channels.20+ integrations across channels such as social advertising, search ads, email marketing more.Reporting solution for marketers with multi-client management multi-channel marketing.Everything your marketing team needs to impress clients earn more revenue for your agency business.
Dashboards
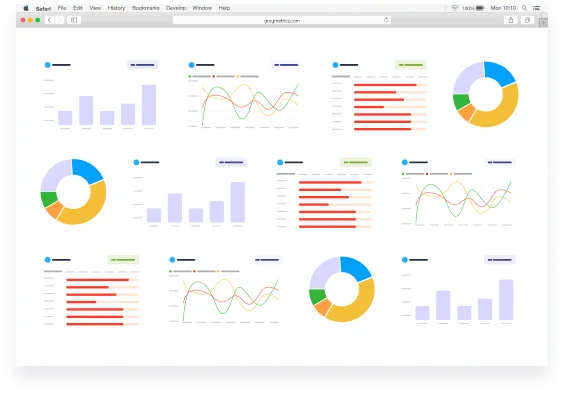
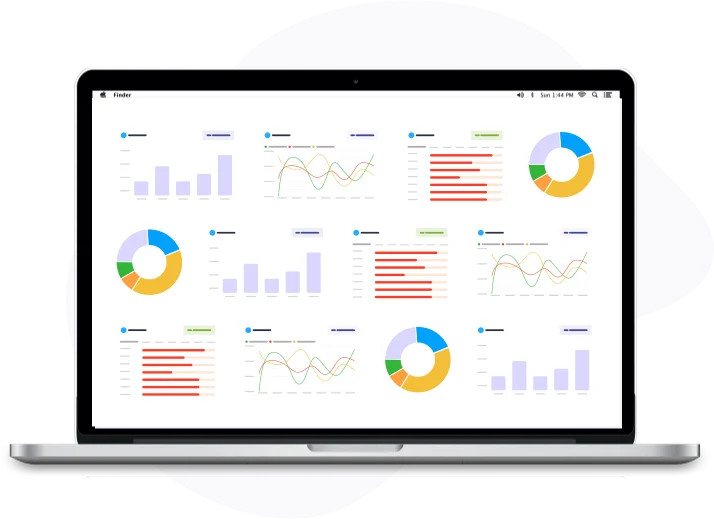
Dashboards for smart marketers for real-time view of marketing data across multiple channels.
Learn MoreIntegrations
20+ integrations across channels such as social advertising, search ads, email marketing more.
Learn MoreReports
Reporting solution for marketers with multi-client management multi-channel marketing.
Learn MoreFeatures
Everything your marketing team needs to impress clients earn more revenue for your agency business.
Learn More - Reports
- Dashboards
- Pricing
- SupportGreyMetrics Knowledgebase
Our detailed knowledgebase contains how to guides for all our features and can help you get started
- Blog
Custom
Google Ads Reporting
Tool
your Google Ads reports quickly without any coding effort.
Custom Reporting Features
Facebook page insights reports and performance data in a beautiful reporting dashboard. Professional, predefined report templates to make your reporting faster & more insightful.
Top performing keywords
Closely monitor the open rates & other email marketing trends.
Is your average time on call increasing or decreasing? Get a clear view
Remarketing performance
Pinpoint areas that have highest call volumes & identify call trends.
Track Your Conversions
Track conversions, cost per conversion
& overall revenue from Google ads report. Identify the keywords bringing in revenue
and optimise your ads. Keep a tab on cost
per conversion and optimize your conversion rate.
- Top Converting Keywords
- Overall Conversions & Revenue
- Avg. Cost per Conversion


Quickly highlight Ads that are performing etter than the rest. Track Ad impressions (CPM) , Total clicks, Cost per click (CPC)
to put a finger on the best ads on your Google Ads portfolio.
- Impressions & Clicks
- Cost Per Click (CPC)
- Avg. CPM
report with your client. Track conversions, revenue, ad clicks, impressions, top
keywords, identify which age group, gender, geographic area is responding better to your ads. Build your custom Google Ads report
in a few clicks & help your client stay
in the loop.
- Easy to Understand Google Ads Reports
- Track Ad Clicks, Conversions
- Save your time on Reporting


Drag & Drop data widgets to create
perfect reports
- Data from 20+ Integrations
- Add & Remove Data Widgets
- Social Media, SEO, PPC Report Templates & More
- Connect Marketing Accounts Only Once
- Schedule Beautiful Client Reports
- Add Team Members & Share Work

